How do I make the x-axis labels stick to the edge of the trend chart?
Problem Description
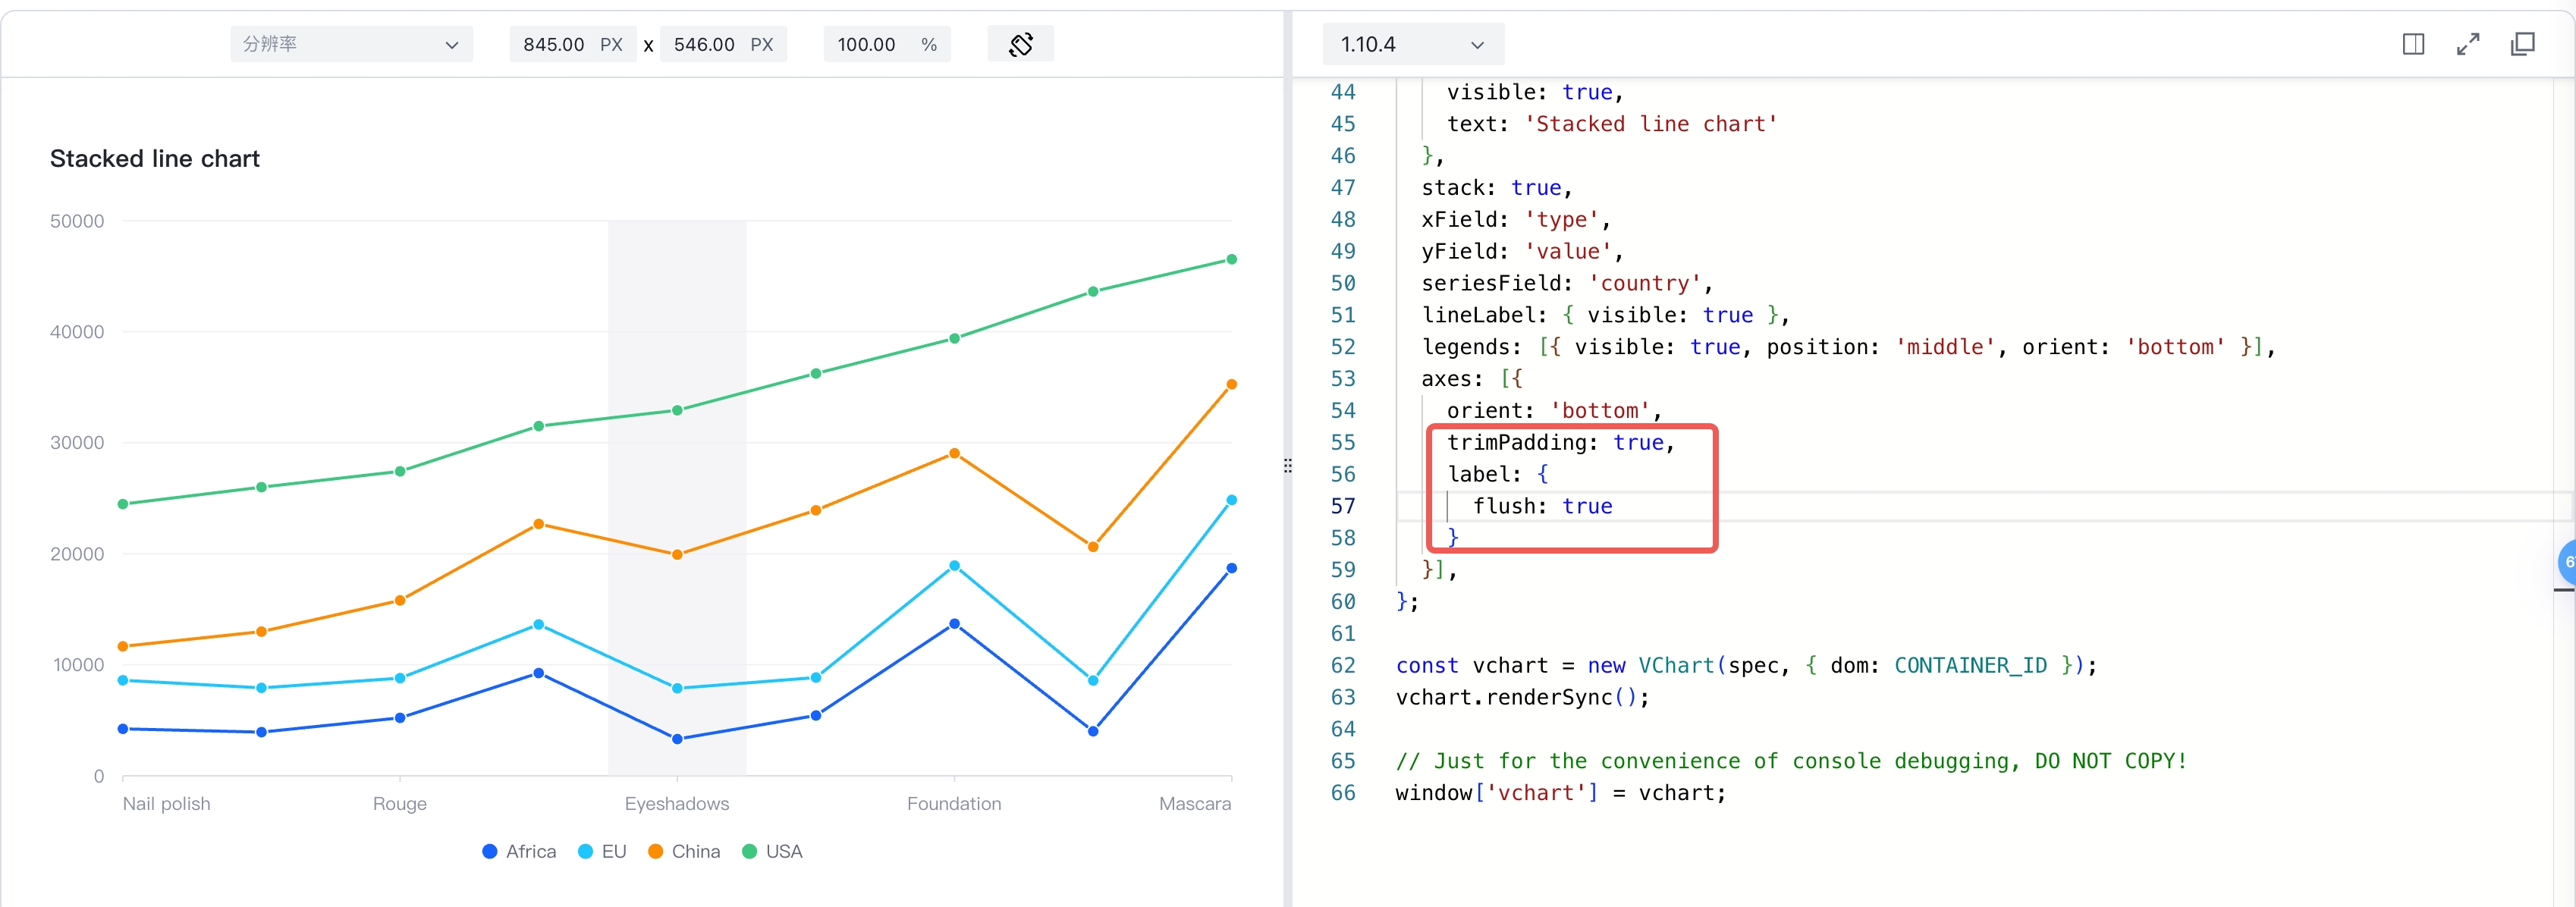
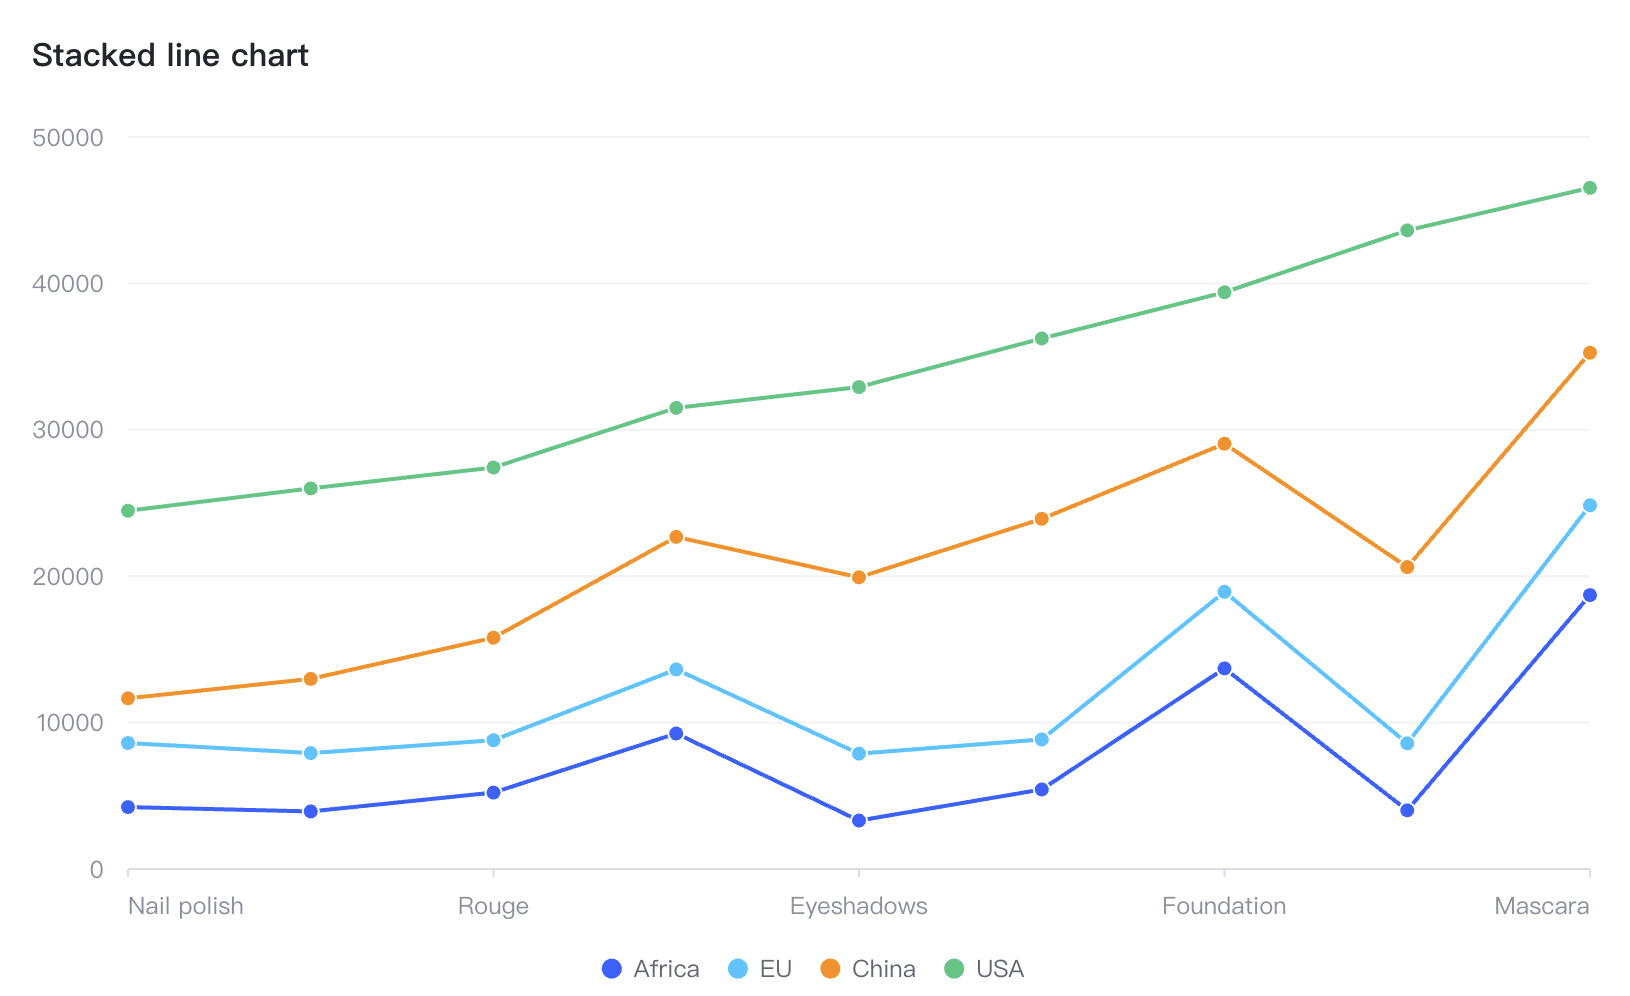
As shown in the figure, can the label on the leftmost side of the x-axis of the trend chart be aligned with the left border of the chart area, and the label on the rightmost side be aligned with the right border of the chart area?

Solution
- When the axis type is
band, you can eliminate thepaddingon the left and right sides by configuringtrimPadding: true - The value of
label.flushistrue, which means the axis label is indented inward and does not exceed the axis range

Code Examples
const spec = {
  type: 'line',
  data: {
    values: [
      { type: 'Nail polish', country: 'Africa', value: 4229 },
      { type: 'Nail polish', country: 'EU', value: 4376 },
      { type: 'Nail polish', country: 'China', value: 3054 },
      { type: 'Nail polish', country: 'USA', value: 12814 },
      { type: 'Eyebrow pencil', country: 'Africa', value: 3932 },
      { type: 'Eyebrow pencil', country: 'EU', value: 3987 },
      { type: 'Eyebrow pencil', country: 'China', value: 5067 },
      { type: 'Eyebrow pencil', country: 'USA', value: 13012 },
      { type: 'Rouge', country: 'Africa', value: 5221 },
      { type: 'Rouge', country: 'EU', value: 3574 },
      { type: 'Rouge', country: 'China', value: 7004 },
      { type: 'Rouge', country: 'USA', value: 11624 },
      { type: 'Lipstick', country: 'Africa', value: 9256 },
      { type: 'Lipstick', country: 'EU', value: 4376 },
      { type: 'Lipstick', country: 'China', value: 9054 },
      { type: 'Lipstick', country: 'USA', value: 8814 },
      { type: 'Eyeshadows', country: 'Africa', value: 3308 },
      { type: 'Eyeshadows', country: 'EU', value: 4572 },
      { type: 'Eyeshadows', country: 'China', value: 12043 },
      { type: 'Eyeshadows', country: 'USA', value: 12998 },
      { type: 'Eyeliner', country: 'Africa', value: 5432 },
      { type: 'Eyeliner', country: 'EU', value: 3417 },
      { type: 'Eyeliner', country: 'China', value: 15067 },
      { type: 'Eyeliner', country: 'USA', value: 12321 },
      { type: 'Foundation', country: 'Africa', value: 13701 },
      { type: 'Foundation', country: 'EU', value: 5231 },
      { type: 'Foundation', country: 'China', value: 10119 },
      { type: 'Foundation', country: 'USA', value: 10342 },
      { type: 'Lip gloss', country: 'Africa', value: 4008 },
      { type: 'Lip gloss', country: 'EU', value: 4572 },
      { type: 'Lip gloss', country: 'China', value: 12043 },
      { type: 'Lip gloss', country: 'USA', value: 22998 },
      { type: 'Mascara', country: 'Africa', value: 18712 },
      { type: 'Mascara', country: 'EU', value: 6134 },
      { type: 'Mascara', country: 'China', value: 10419 },
      { type: 'Mascara', country: 'USA', value: 11261 }
    ]
  },
  title: {
    visible: true,
    text: 'Stacked line chart'
  },
  stack: true,
  xField: 'type',
  yField: 'value',
  seriesField: 'country',
  lineLabel: { visible: true },
  legends: [{ visible: true, position: 'middle', orient: 'bottom' }],
  axes: [{
    orient: 'bottom',
    trimPadding: true,
    label: {
      flush: true
    }
  }],
};</br>
Results Display

